Christy Lynn
This is our first guide on techniques you can use to trade your cryptocurrencies and better understand the crypto markets. It’s important to note, this is not financial or investment advice. You should consult with a certified financial planner before making decisions based on any techniques from these posts. Keep your eyes out for more technical trading guides in the upcoming weeks. Also, let us know what you’d like to see! This beginner-friendly article will go over the basics of what simple moving averages are, and popular ways to use them in crypto-trading and coin analysis.
Quick answer: A simple moving average (SMA) is the average closing price over a set number of periods, plotted as a line to smooth out price noise. Crypto traders commonly watch the 50-day and 200-day SMAs: price above the 200-day SMA suggests a long-term uptrend, and below it suggests a downtrend. When the 50-day crosses above the 200-day, it’s called a golden cross (bullish). When it crosses below, it’s a death cross (bearish).
What are Simple Moving Averages?
I am sure you have seen the candle charts within exchanges and platforms that show the highs, lows, and everything in between that coins is selling for. Imagine we are looking at one of these candle charts in terms of days. Each candle on that chart would have an opening price and closing price for each day. Simply put, a simple moving average takes closing prices and averages them together. For example, let’s say we are looking at a 20-day span. We would be looking at 20 candles (one for each day) and each one of those candles has a closing price. To calculate a simple moving average, we would take those 20 closing prices, and divide them by our 20 days. The equation for our 20-day example would look like this: SMA = (Closing Price Day 1 + Closing Price Day 2 + … Closing Price Day 20) / (20) The simple moving average (SMA) is a basic, yet popular tool to trade and invest in cryptocurrencies. Using SMAs can help investors find support and resistance points in the market and assist in finding good buying points during pull-backs. As you’ll see below, simple moving averages can be an interesting way to gauge fear or confidence/excitement in a market.

Trade with lower fees on Kraken Pro
- Advanced charts and order types
- Maker-taker fees that drop with volume
- Security record since 2011
Trading is risky. Start small and only risk what you can afford to lose. Affiliate link.
Setting Up a Simple Moving Average for Crypto-Trading
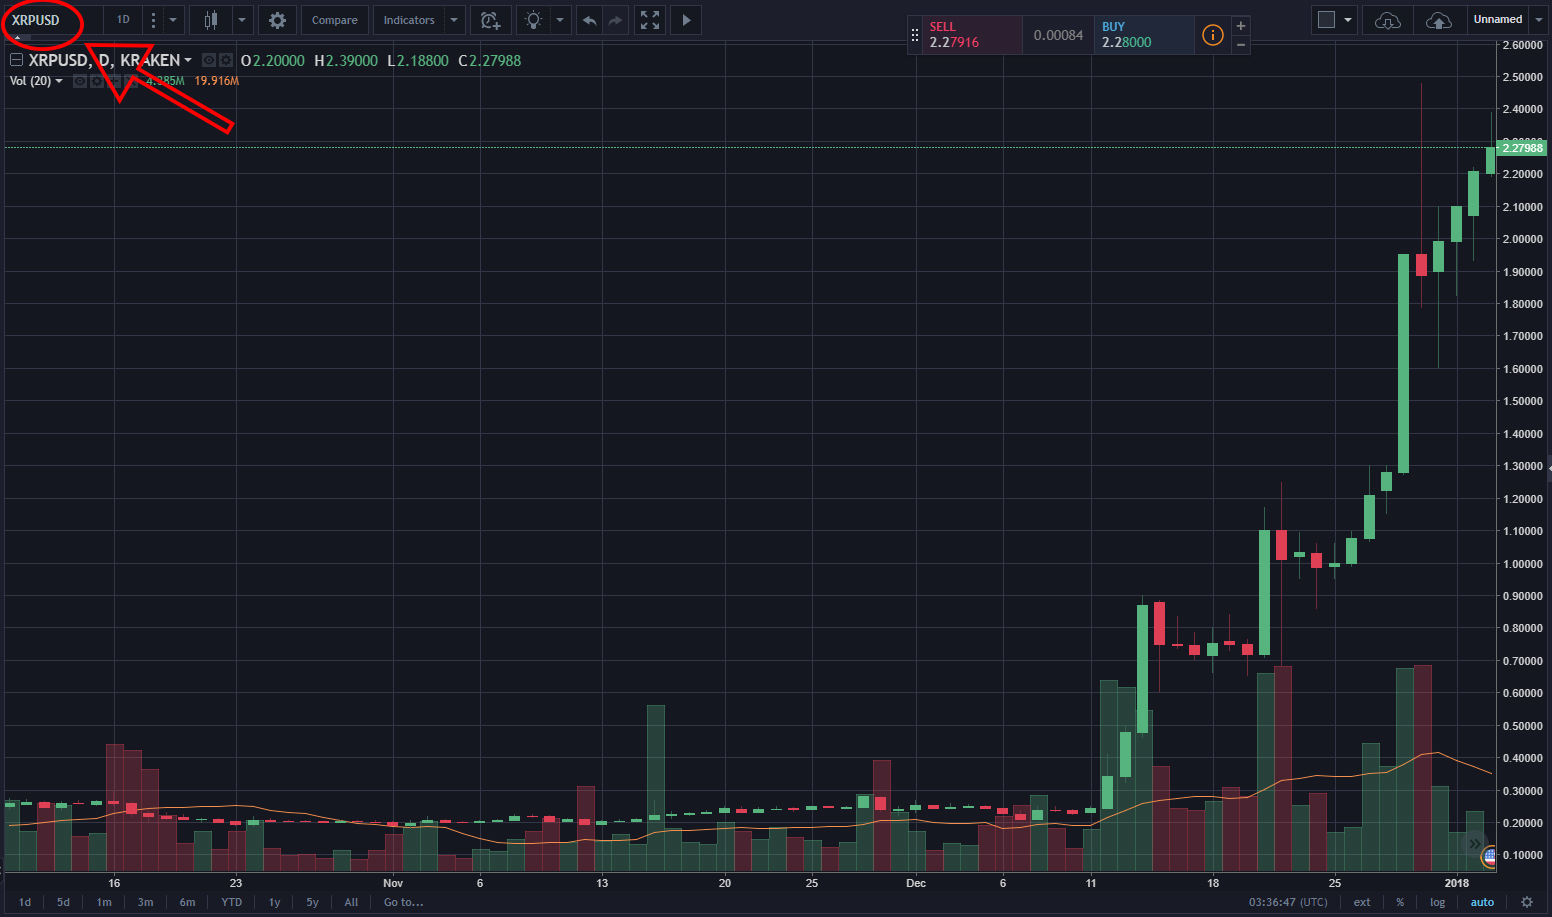
Here’s where the fun part begins! If you’d like to follow along in learning how to set up a simple moving average, you can go to the Trading View website. I am using XRP for this example, but you can choose ANY crypto that you like.
- Choose the currency you’d like to view (I am using XRP). You’ll find the option to do this in the upper left-hand corner. Make sure you are viewing candles by day (1D).
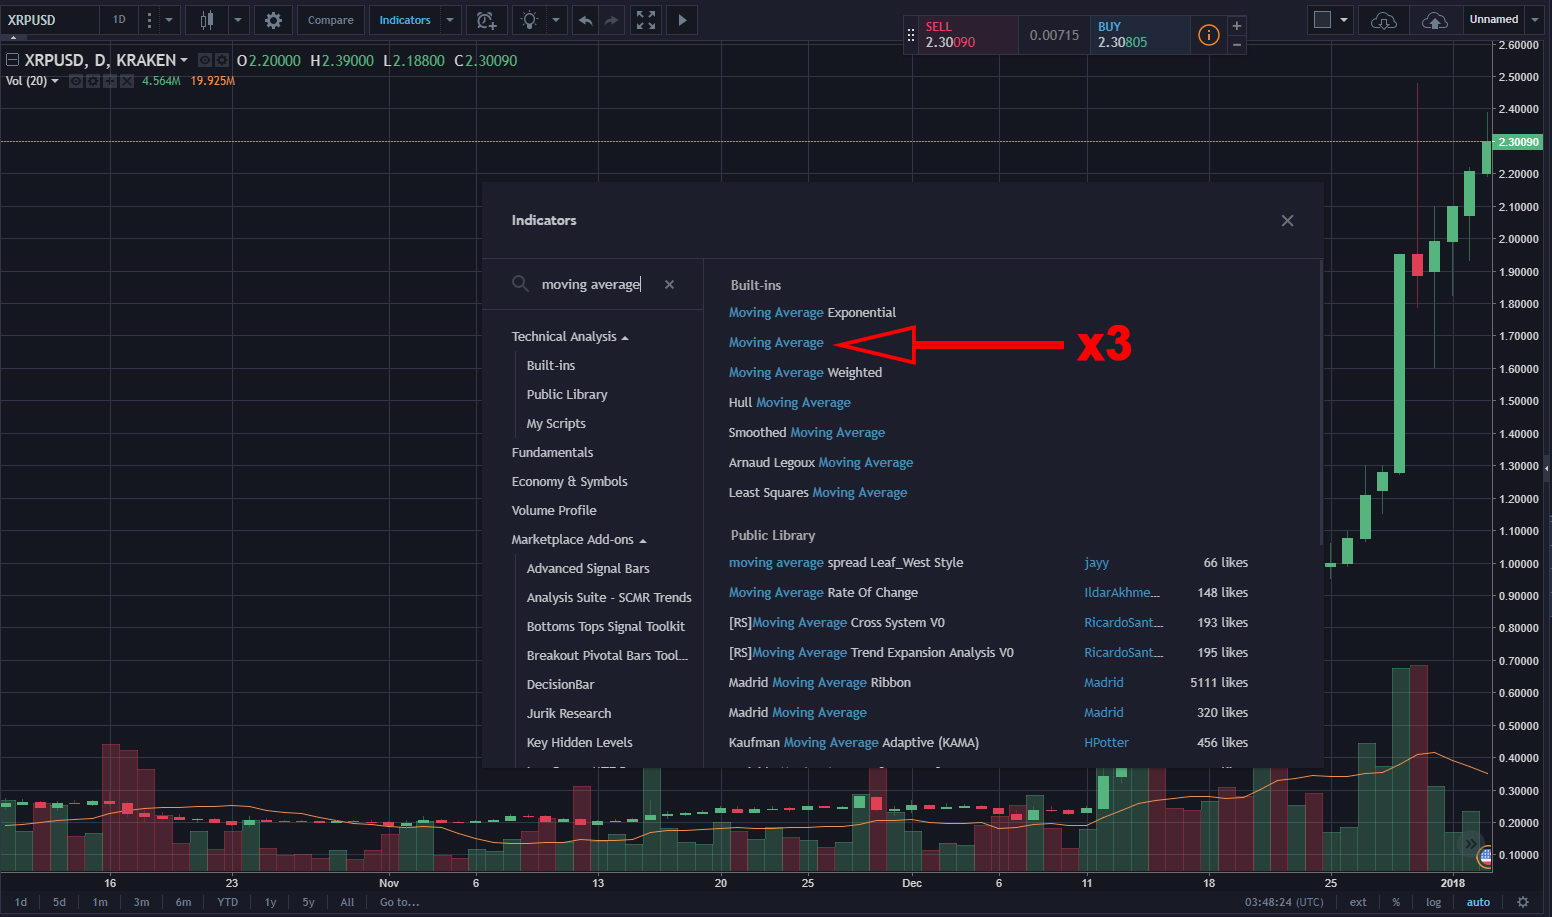
- Next, go to the “Indicators” tab at the top of the page.
- Once you’re in the Indicators tab, type in “Moving Average” and click on it three times. We will be creating three moving averages on our graph.
- You’ll find the moving averages near the top left of your trading chart (by default, it will say something like MA (9, close)). Click on the “Gear” icon to the right of your first moving average.
- Change the “Length” of this moving average to 50 (this is the number of closing prices we spoke about earlier).
- Go to your next moving average and change the length to 100.
- For the last moving average, you’ll enter a length of 200. Now we have a moving average for 50 closing days, one for 100 closing days, and one for 200 closing days. These should be color-coded on your graph.
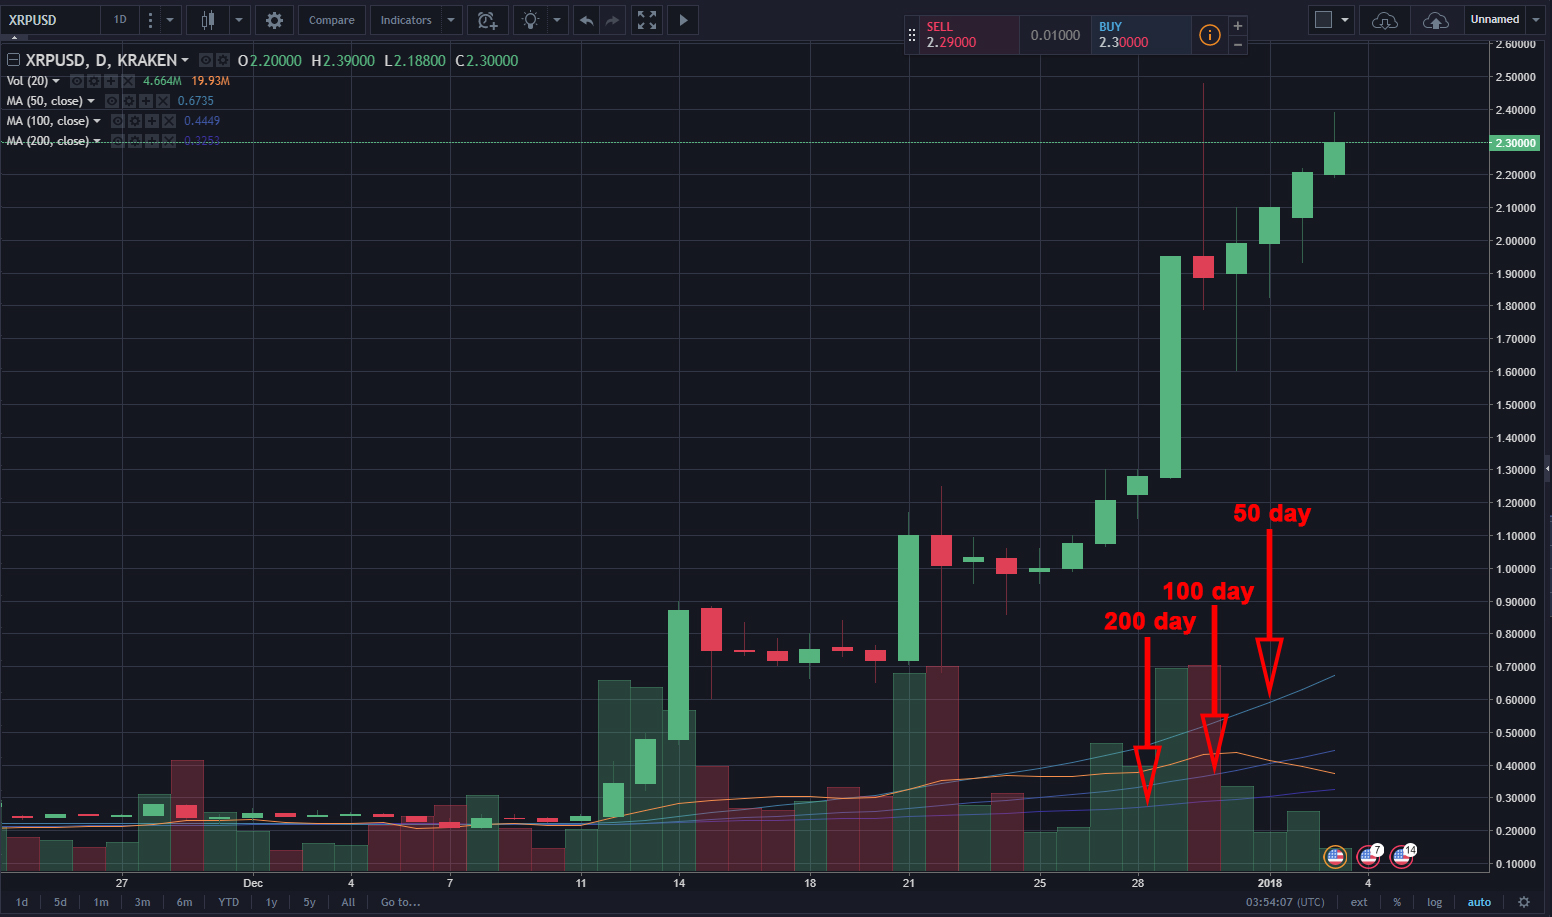
Now look at your chart – what do you initially see…or think you see?
What Does This All Mean?
Using 50, 100, and 200 days is fairly standard. You can think of the 50-day SMA as a confidence indicator. Time periods where the candles are above the 50-day line usually mean that it’s fairly safe to say that there is a lot of confidence within the market and can be called a “golden cross.” If this is partnered with higher-than-average trading volumes, this can mean that gains are in-store! If your candles go below the 50-day line, this can mean that there is fear in the market. Maybe negative news has come out, restrictions have been mandated, or a variety of other factors could impact this. If the candles dip cross through the 200 day, this is called a “death cross,” and this can mean there is a LOT of fear in the market, and we’re experiencing a significant pullback. Typically, markets will find stability when they reach these 50, 100, or 200 marks and hit some resistance at these points. Because of this powerful visualization, these indicators can give you an idea during your crypto-trading journey of when may be a good time to purchase on a pullback.
Free masterclass
Learn crypto the right way.
Christy Lynn’s free beginner course, straight to your inbox. Plain English, never spammy.

Join free and get one 5-minute lesson in your inbox every 1–2 days:
✅ What crypto actually is, in plain English
✅ The 5 safety rules that protect your money from scams
✅ Where to buy, and exactly how to invest your first $100
✅ How to store your crypto safely and earn staking rewards
✅ How to research coins and handle crypto taxes
No hype, no spam. Unsubscribe anytime.
Frequently asked questions
What is the best moving average for crypto?
The 200-day SMA is widely watched for long-term trends, and the 20- and 50-day SMAs for shorter-term trends.
What is the difference between SMA and EMA?
An EMA (exponential moving average) gives more weight to recent prices, so it reacts faster than an SMA.
What is a golden cross?
When the 50-day SMA crosses above the 200-day SMA, often seen as a bullish long-term signal.